goseq output
With these parameters, “goseq” generates three outputs -
A table (Ranked category list - Wallenius method) with the following columns for each GO term:
category - GO category
over_rep_pval - p-value for over-representation of the term in differentially expressed genes
under_rep_pval - p-value for under-representation of the term in differentially expressed genes
numDEInCat - number of differentially expressed genes in this category
term - detail of the term
ontology - MF (Molecular Function - molecular activities of gene products), CC (Cellular Component - where gene products are active), BP (Biological Process - pathways and larger processes made up of the activities of multiple gene products)
p.adjust.over_represented - p-value for over-representation of the term in the differentially expressed genes, adjusted for multiple testing with the Benjamini-Hochberg procedure
p.adjust.under_represented - p-value for under-representation of the term in the differentially expressed genes, adjusted for multiple testing with the Benjamini-Hochberg procedure
A graph with the top 10 over-represented GO terms
A table with the differentially expressed genes associated to the GO terms
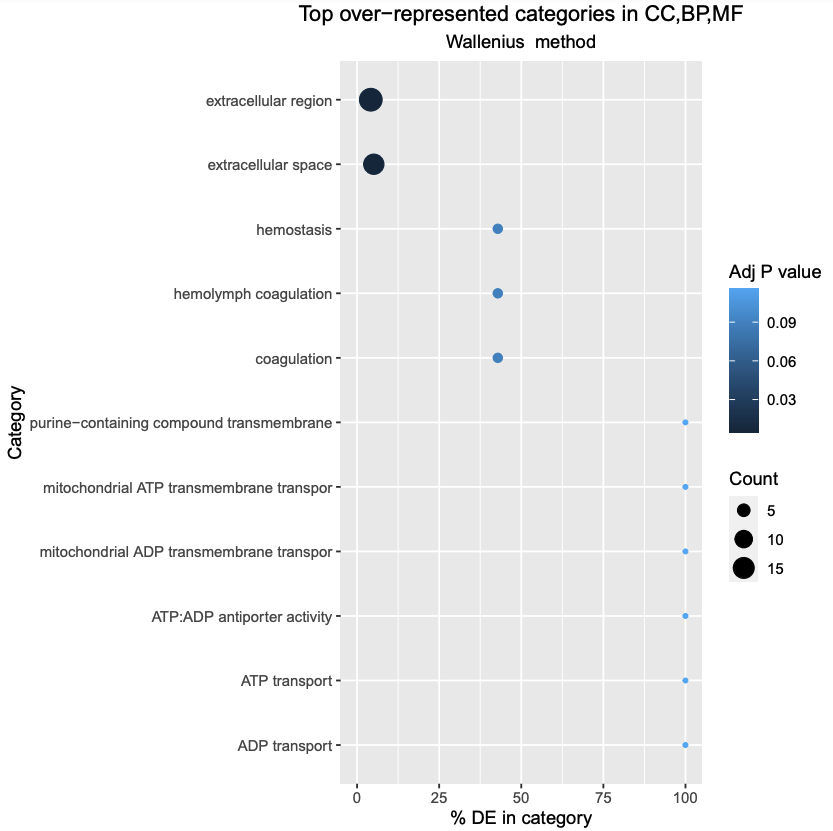
A plot generated by goseq tool showing the top over-represented GO terms