KEGG pathway analysis
For KEGG analysis, let’s start with the users running the workflow. These are the tools that will be used -
goseq
Cut
Pathview
For users using the workflow
You don’t have to enter any parameters or values at this point. You can read further down this page if you would like to know how the other tools work and what they do (This will also show you the default parameters).
For users running each step separately, let’s start breaking down the steps to run a KEGG pathway analysis -
The first tool that we use is “goseq” which we used earlier -
If you have performed the “Gene Ontology analysis” step, you would have the two files, “Gene IDs and differential expression” and “Gene IDs and length”
Under “Differentially expressed genes file”, select “Gene IDs and differential expression” and select “Gene IDs and length” under “Gene lengths file”
Select “Get categories” under “Gene categories” and the genome that you would like to select under “Select a genome to use”
If your gene annotations contain Ensembl gene IDs, select “Ensembl Gene ID” under “Select Gene ID format”. Please note: if your GTF file has a different Gene ID format, be sure to select that from the dropdown menu
Under “Select one or more categories”, pick “KEGG”
In “Output options”, select “No” under “Output Top GO terms plot”
Under “Extract the DE genes for the categories (GO/KEGG terms)”, select “Yes”
Click on “Execute”
This tool outputs two tables - * A large table with the KEGG terms and related statistics
A table with the differentially expressed genes associated with the KEGG pathways
The second tool that we use is “Cut”
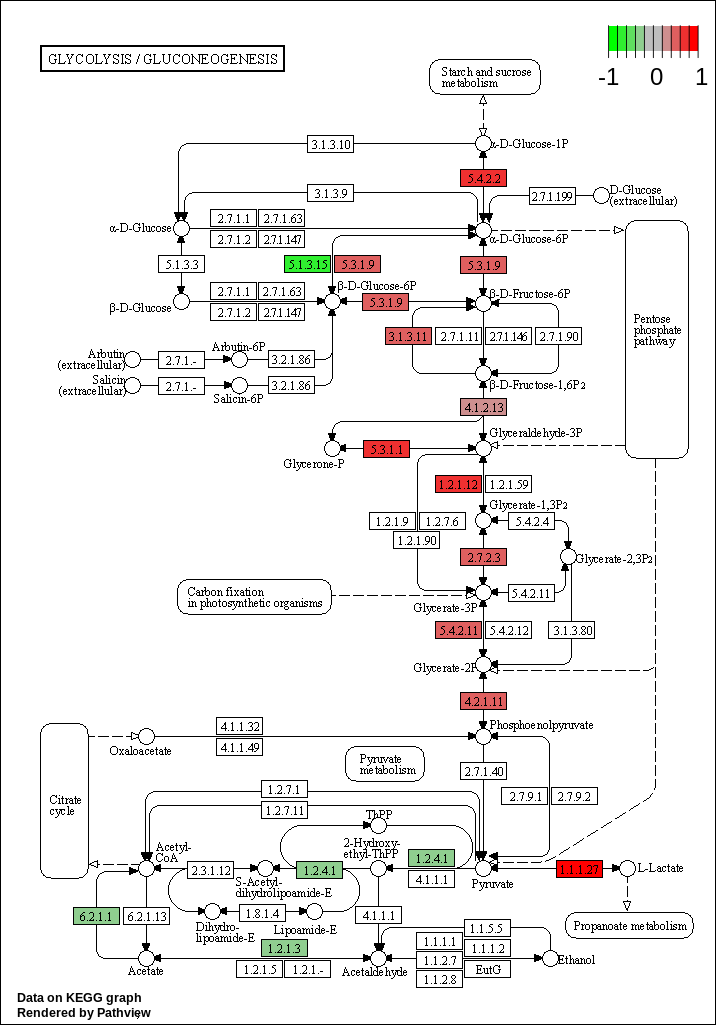
We have KEGG analysis done and we have diffferentially expressed gene’s information and we would like to put together and overlay the log2 FC on the KEGG pathway
A new table can be created from a earlier table using “Cut”
Search for the tool under “Tools”
Under “Cut columns”, enter “c1, c3” (We want to extract the Gene ID and Log2Fold change for the genes that have a significant adjusted p-value)
Select “Tab” under “Delimited by”
The file “From” should be the earlier file we created “Genes with significant adj p-value”
Rename the file to “Genes with significant adj p-value and their Log2 FC”
Create a new tabular file from the pathway IDs that you are interested in plotting and rename it as “KEGG pathways to plot”
For the next step, we need a file with KEGG pathways that we are interested in. You could have your own list of pathways. You could download this example file (Above “History”, click on the three dots and download the file) from this page and upload the file to Galaxy using instructions from here
The third tool that we will use is called “Pathview”
Search for the tool under “Tools”
Under “Number of pathways to plot”, select “Multiple”
Select “KEGG pathways to plot” under “KEGG pathways”
Under “Does the file have header (a first line with column names)?”, select “No” (Until your file has headers)
Under species to use, select the genome you are working with
Under “Provide a gene data file?”, set “Yes”
Enter the output of Cut under “Gene data”
“Does the file have header (a first line with column names)?”, select “No”
Under “Format for gene data”, enter “Ensembl gene ID”. Please note: if your GTF file has a different Gene ID format, be sure to select that from the dropdown menu
Set “No” to “Provide a compound data file?”
In “Output options”
Select “KEGG native” for “Output for pathway”
Set “Yes” for “Plot on same layer”
Click on “Execute”